This research is part of the European Commission funded research project ECHOES which attempts to understand the individual’s place in the transition to a renewable energy system and energy choices.
This is a survey-based research implemented in 31 European countries and over 18,000 respondents are covered. In order to investigate the willingness to pay for an environmentally friendly public transportation in local area, each respondent was asked if they are willingness to pay some amount of money in tax per month to support this proposal.
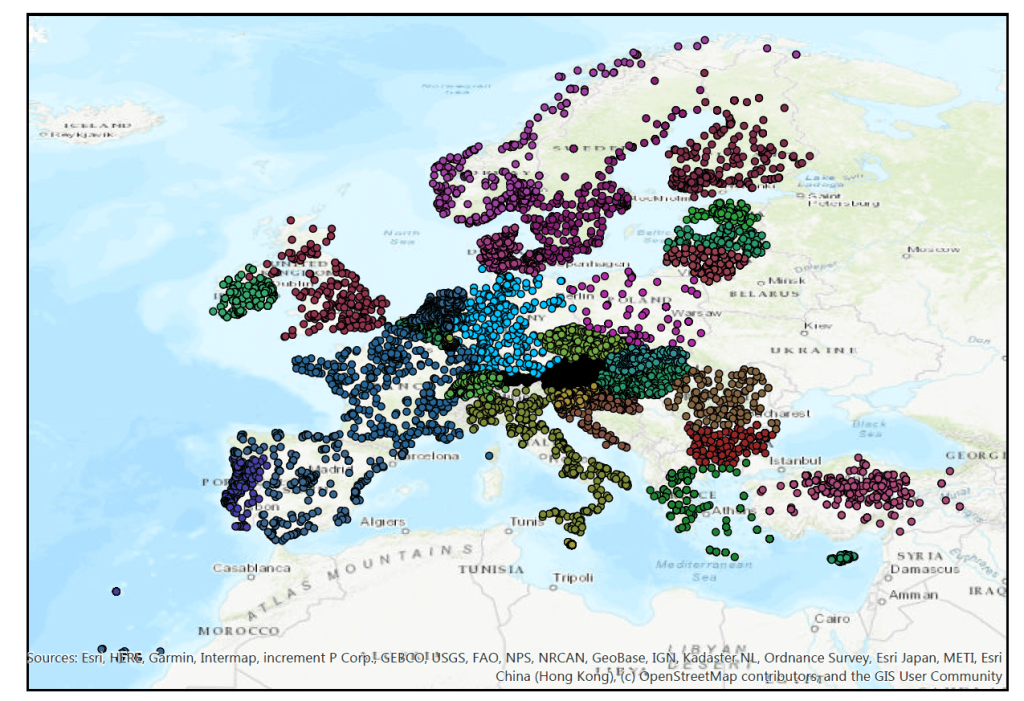
After collecting all the socio-demographic information from respondents, such as age, education, monthly income and residency in current address, etc, we also need to identify the spatial location of all respondents and get the location-specific information for each of them, such as precipitation, temperature and elevation, etc. Here is the spatial location of all respondents based on provided postal codes from respondents.
With collected socio-demographic variables and location-specific variables, we investigate the WTP for EFPT using an updated Bayesian logit with identified scale model. By switching to a Bayesian estimation framework, we do not need to invoke asymptotic theory to interpret estimation results. Furthermore, compared to maximum likelihood estimation (MLE), our Bayesian logit model is less sensitive to the choice of starting values, and less likely to “get stuck” at a local maximum. In addition, the actual WTP predictions can be obtain from Bayesian output in straightforward fashion without the need to resort to asymptotic tools and second-stage methods to obtain standard errors.
The predictive posterior distribution of WTP across all countries are given as follows.
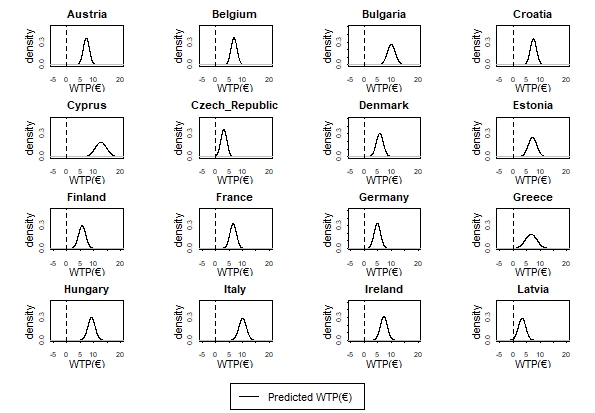
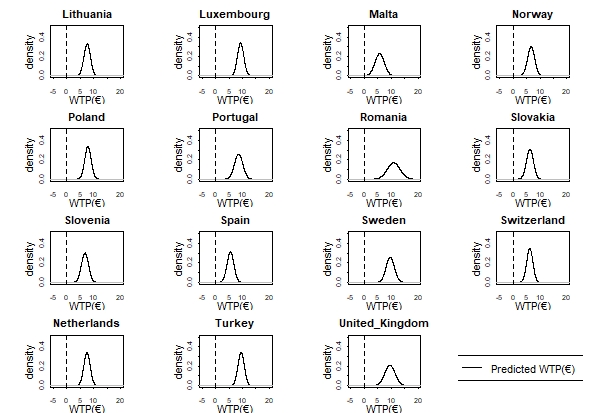
In these figures, a dashed vertical zero-line in each subplot is superimposed. It is obvious from these figures that the predicted WTP distribution for most countries is located to the right side of the zero line, indicating a positive WTP for the introduction of EFPT. Also, it is worthwhile to notice that the shapes of these predictive densities are similar except for Cyprus, Greece and Romania, which exhibits a more spread-out WTP distribution.
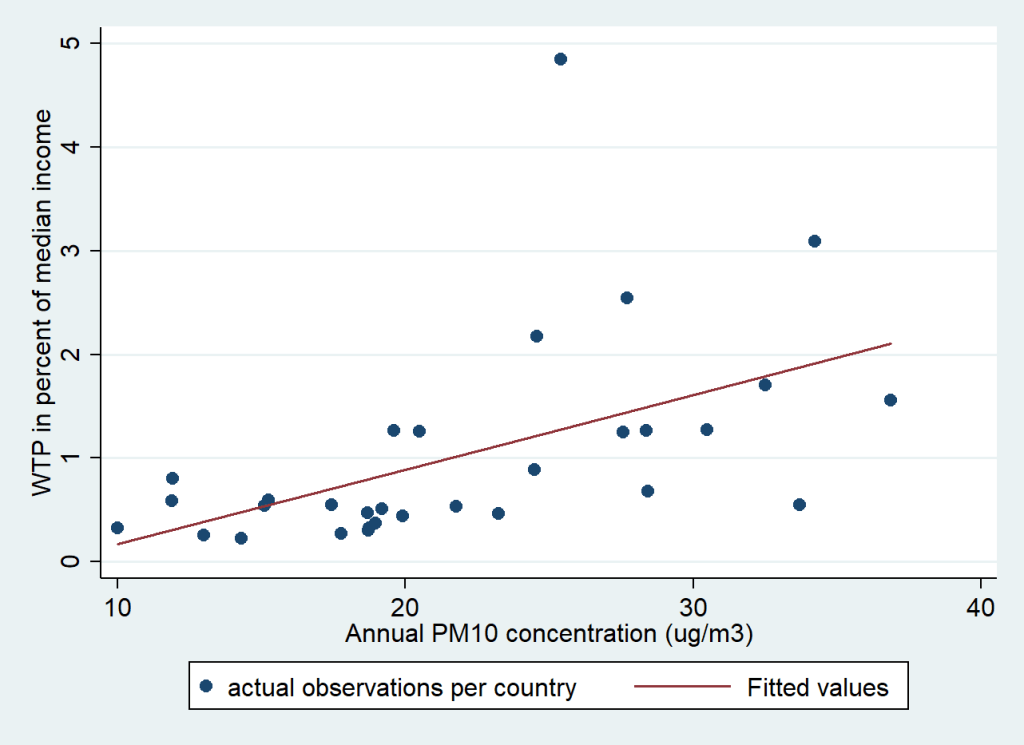
In addition to numerical values and graphical representations of predicted WTP, it is
also of interest to analyze the relationship between predicted WTP and air pollutants as the implementation of EFPT would presumably lead to better local air quality. The following figure illustrates the relationship between the WTP expressed in terms of percentage of median income for each country to average annual PM10 concentrations. As can be seen the figure, the percentage of WTP relative to median income is increasing as PM10 concentration increases. The fitted curve super-imposed on each figure can be interpreted as a marginal damages curve. Its positive slope does indeed suggest that a higher pollution level leads to higher WTP, that is higher societal benefits from cleaner air.